Diagram and Photo Interpretation in Safety Systems
ProQual Level 7: Knowledge Tasks in Global Safety Performance
Table of Contents
Introduction to the Task
This task presents the learner with a set of detailed described images/diagrams representing realistic workplace conditions. Although the actual images are not provided visually, each image is described with enough clarity to allow a high-level interpretation similar to real-life safety inspections.
The purpose of this task is to:
- Strengthen hazard identification and interpretation skills
- Analyse deeper organisational, cultural, and sustainability issues revealed by site conditions
- Connect observations to global safety challenges (climate, supply chain pressures, economic constraints, etc.)
- Assess psychological, behavioural, and cultural implications
- Propose sustainable and evidence-based corrective actions
- Evaluate performance metrics and determine safety-investment ROI
This task mirrors the type of advanced analytical work expected of senior HSE leaders, auditors, and strategic risk managers.
Scenario Overview
You are a senior HSE auditor conducting an announced site inspection at a multinational manufacturing facility. The organisation operates in the metal fabrication, tooling, and assembly industry. As part of the audit process, you are given a series of photographs and diagrams (described below). Your job is to:
- Analyse what each image indicates
- Interpret underlying safety culture, sustainability, and psychological/organisational issues
- Identify non-compliances, risks, and defects
- Recommend strategic corrective measures
- Link findings to global trends and pressures impacting performance
Photo / Diagram Set (Described)
Below are the detailed descriptions of the site images you will be analysing:
Image 1: Waste Disposal Area Behind the Manufacturing Facility
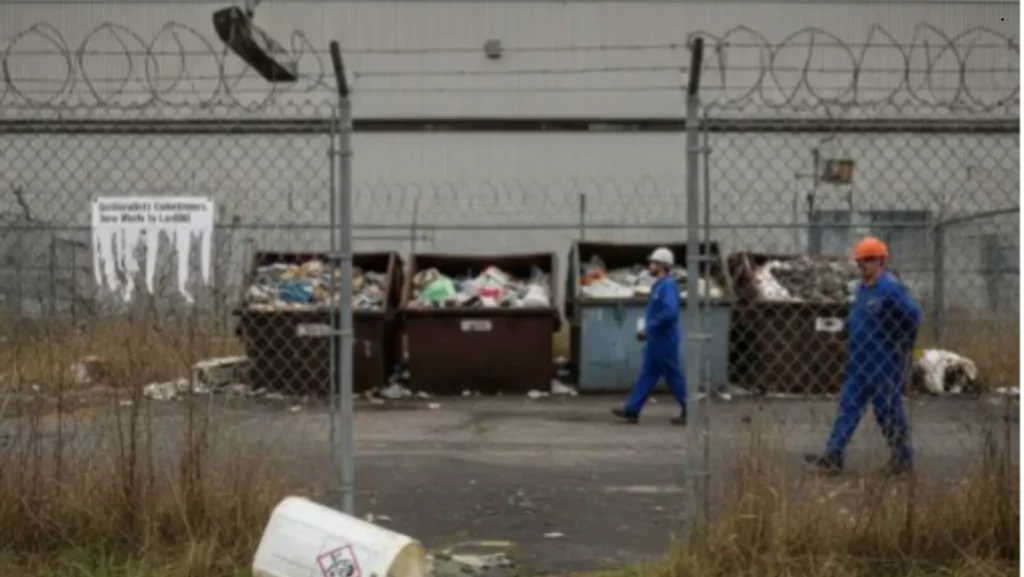
The photo shows:
- A fenced waste storage zone with overflowing bins
- Mixed waste: metal scraps, plastic wrappers, paint containers, oily rags
- At least three bins are unlabelled
- One container with a chemical hazard symbol is lying on its side leaking fluid
- Two workers walk past the area without noticing the spill
- Grass around the fence appears dead and discoloured
- A faded “Sustainability Commitment: Zero Waste to Landfill” sign is visible but partly torn
- CCTV camera above the waste area appears broken
Image 2: Welding Bay Environment

The photo shows
- A welder performing grinding without face shield and apron
- Welding fumes visible in the air but the extraction arm is pulled back and unused
- Multiple flammable liquid containers placed near a spark source
- Safety posters are on the wall but covered with dust and outdated (posted 7 years ago)
- A production supervisor stands in the background talking on a mobile phone, not observing the work
- A digital thermometer on the wall shows 37°C due to poor ventilation
Image 3: Worker Wellbeing and Rest Area

The photo shows:
- A small, dimly lit break room with no ventilation
- A handwritten note on the wall: “No long breaks due to production targets”
- A cracked water dispenser with a bucket underneath to catch drips
- Three workers sitting with exhausted expressions, one rubbing their shoulder in pain
- Psychosocial support hotline poster is faded and unreadable
- First aid box is locked and no responsible person is present
Diagram 4: Safety Performance Dashboard (Past 12 Months)
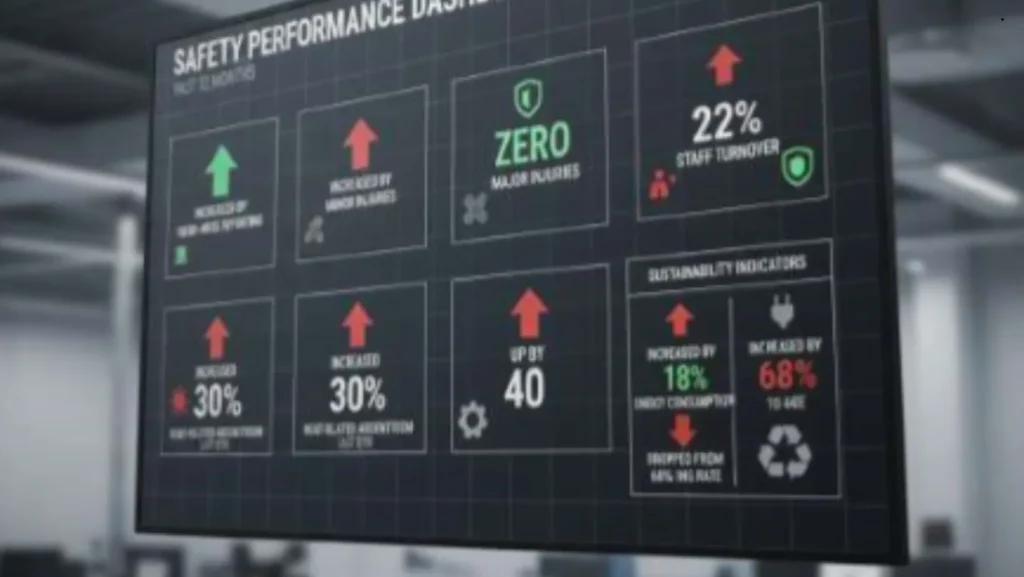
The dashboard shows:
- Increase in near-miss reporting by 45%
- Increase in minor injuries by 15%
- Zero major injuries
- Staff turnover increased by 22%
- Heat-related absenteeism increased 30% in the last quarter
- Maintenance backlog up by 40%
- Sustainability indicator: Energy consumption increased by 18%
- Sustainability indicator: Recycling rate dropped from 68% to 44%
Task Instructions
Study each described image carefully and answer the analytical questions below. Your answers must include Level 7 depth—strategic interpretation, system-level reasoning, and connections to global safety culture and sustainability trends.
Task Questions
Section A – Observation and Interpretation
1. Image Observations
For each image/diagram, list all observable hazards, non-compliances, behavioural indicators, and safety culture signals.
Your observations must cover:
- Physical hazards
- Sustainability failures
- Psychological health indicators
- Leadership and cultural elements
- Evidence of system weakness or organisational drift
Section B – Linking to Global Safety Culture and Sustainability Issues
2. Global Influences Analysis
For each image, explain how global issues may be contributing to the problems observed, such as:
- Climate change impacts on worker health (e.g., heat stress)
- Global supply chain pressures affecting maintenance and PPE availability
- Economic constraints affecting workforce morale
- Cultural diversity challenges in multinational settings
- International sustainability trends and ISO 14001 expectations
Provide at least two global influences per image.
Section C – Strategic Corrective Measures
3. Corrective Actions (Technical + Organisational)
For each image, propose high-level corrective and preventive actions, including:
- Engineering controls
- Sustainable waste/energy improvements
- Leadership and behavioural interventions
- Psychological health support measures
- Training and awareness improvements
- Systemic changes in management reviews, procurement, and KPIs
Actions must reflect integrated thinking between safety culture, sustainability, and performance.
Section D – Safety Performance and ROI
4. Performance Measurement
Using the safety dashboard (Diagram 4), answer:
- What do the trends indicate about the facility’s current safety culture?
- Which leading indicators show early signs of deeper problems?
- Calculate how a 10% reduction in absenteeism could financially impact productivity if the average daily worker cost is £180 and current heat-related absenteeism results in 180 lost days per quarter.
(Show your calculations.)
5. Investment Return (Strategic ROI)
If management invests £25,000 in:
- Upgraded ventilation
- Heat-stress monitoring sensors
- Workforce wellbeing programme
Explain:
- What safety performance improvements should be expected?
- Which sustainability KPIs will also benefit?
- How can the organisation calculate ROI beyond financial metrics (e.g., reputation, retention, global compliance)?
Section E – Psychological Health and Injury Management
6. Psychosocial Risk Evaluation
Using Image 3:
- Identify key psychosocial hazards
- Explain how these hazards impact injury rates, staff turnover, and long-term performance
- Recommend a psychological injury management framework aligned with global best practices (e.g., ISO 45003)
Expected Deliverable
Learners should produce a comprehensive, evidence-based analysis (1500–2500 words recommended) that demonstrates:
- Advanced interpretation of visual data
- Understanding of global influences on safety culture
- Integration of sustainability and wellbeing into safety systems
- Strategic action planning and ROI justification
- Professional-level depth aligned with Level 7 leadership competencies